Time Zones
This notebook demonstrates converting time zones for predicting local tides.
Tide tables are often provided in local time, but pyTMD uses times in UTC for its internal calculations.
The timescale library can handle the conversion into UTC, which is needed for the tidal predictions.
However, timescale does not currently have the built-in functionality to export into different time zones.
Fortunately, the datetime and zoneinfo libraries provide the tools necessary for this conversion.
import datetime
import zoneinfo
import ipywidgets
import numpy as np
import pandas as pd
import pyTMD.compute
import timescale.time
import matplotlib.pyplot as plt
# local timezone info
tzinfo = zoneinfo.ZoneInfo("America/Los_Angeles")
# start and end times (local)
start = datetime.datetime(2026, 1, 1, tzinfo=tzinfo)
end = start + datetime.timedelta(days=10)
# create a range of dates using timescale to convert to UTC
UTC = timescale.time.date_range(start.isoformat(), end.isoformat(), 1, "m")
# calculate a tide prediction using the UTC datetimes
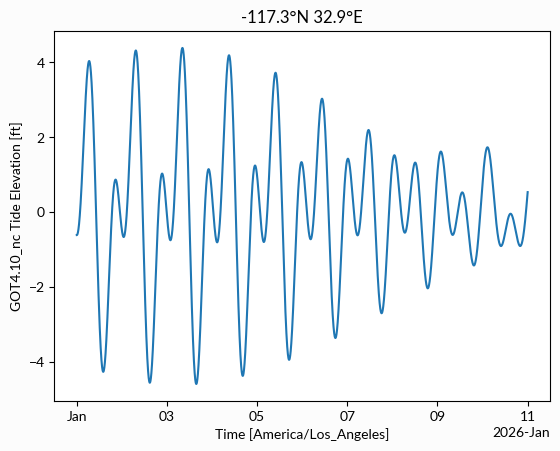
model = "GOT4.10_nc"
units = "ft"
lat = pyTMD.spatial.from_dms(32, 52, 0)
lon = pyTMD.spatial.from_dms(-117, 15, 24)
tpred = pyTMD.compute.tide_elevations(
lon,
lat,
UTC,
model=model,
standard="datetime",
infer_minor=True,
extrapolate=True,
cutoff=30,
)
# convert tide predictions from meters to feet
tpred = tpred.tmd.to_units(units)
# NOTE: using a single UTC offset only works when the time range does not
# include a transition to daylight saving time or the local time zone
# does not observe DST. In the case where there is a transition to DST:
# the offset will need to be added in pieces (before and after transition)
utcoffset = np.timedelta64(start.utcoffset())
# calculate the local datetime array
local_time = UTC + utcoffset
# assign the local time as the DataArray time coordinate
tpred = tpred.assign_coords(time=local_time)
# plot the tide predictions in local time
fig, ax = plt.subplots()
tpred.plot(ax=ax)
ax.set_xlabel(f"Time [{tzinfo.key}]")
ax.set_ylabel(f"{model} Tide Elevation [{units}]")
ax.set_title(f"{lon:0.1f}\u00b0N {lat:0.1f}\u00b0E");
The pandas library also can create time ranges and has built-in time zone capability.
Using pandas is particularly useful for creating a set of local tide tables as DataFrames can be directly converted to human-readable tables.
# create a range of dates using pandas
local_time = pd.date_range(
    start="2026-01-01", end="2026-01-04", freq="min", tz=tzinfo
)
UTC = local_time.tz_convert("UTC").tz_localize(None)
tzshort = local_time[0].strftime("%Z")
# calculate a tide prediction for the given time range
tpred = pyTMD.compute.tide_elevations(
    lon,
    lat,
    UTC,
    model=model,
    standard="datetime",
    infer_minor=True,
    extrapolate=True,
    cutoff=30,
)
# convert tide predictions from meters to feet
tpred = tpred.tmd.to_units(units)
# assign the pandas local time as the DataArray time coordinate
tpred = tpred.assign_coords(time=local_time.tz_localize(None))
# find the peaks in the tide prediction
high_peaks, low_peaks = tpred.tmd.find_peaks()
high_tides = tpred.where(high_peaks, drop=True)
low_tides = tpred.where(low_peaks, drop=True)
# pyTMD uses xarray DataArrays to store the tide predictions
# which can be easily converted to pandas DataFrames for display and analysis
high_tides = high_tides.to_dataframe(f"High Tide [{units}]")
low_tides = low_tides.to_dataframe(f"Low Tide [{units}]")
# combine the high and low tide dataframes into a single dataframe
# sort by the time index and then create a column for the time index
df = pd.concat([high_tides, low_tides]).sort_index().reset_index()
# rename the columns for display
df.rename(
    columns={"x": "Longitude", "y": "Latitude", "time": f"Time [{tzshort}]"},
    inplace=True,
)
# create a HTML table from the DataFrame
html = df.to_html(na_rep="", index=False, notebook=True, float_format="%0.2f")
table = ipywidgets.HTML(value=html)
display(table)