Cropping Tidal Data
This notebook demonstrates cropping tide model data to bounds, which can help improve computational times if only predicting for a regional subset of data.
import pyTMD
import numpy as np
import matplotlib.pyplot as plt
# read dataset
m = pyTMD.io.model().from_database("GOT4.10_nc")
ds = m.open_dataset(group="z")
# bounding box for cropping the dataset
xmin, xmax, ymin, ymax = -180, -120, 40, 80
# convert the bounding box to the native projection of the dataset
X, Y = ds.tmd.transform_as([xmin, xmax], [ymin, ymax], crs=4326)
# interpolation points
lon = np.arange(xmin, xmax, 0.25)
lat = np.arange(ymin, ymax, 0.25)
# convert interpolation points to the projection of the model
x, y = ds.tmd.coords_as(lon, lat, type="grid", crs=4326)
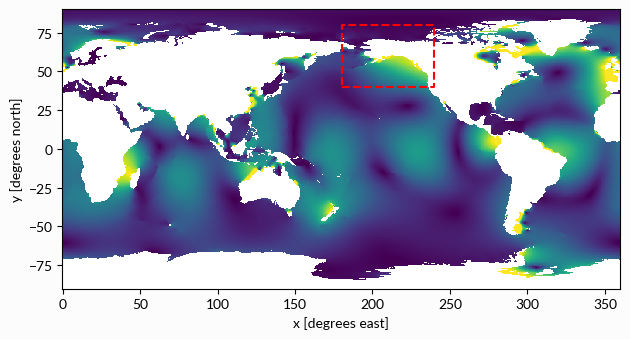
# get the 1st and 99th percentiles of the amplitude for plotting
vmin, vmax = ds.m2.tmd.amplitude.quantile([0.01, 0.99])
# plot the amplitude of a tidal constituent
f1, ax1 = plt.subplots(num=1)
ds.m2.tmd.amplitude.plot(
ax=ax1, vmin=vmin, vmax=vmax, cmap="viridis", add_colorbar=False
)
ax1.plot(
[X[0], X[-1], X[-1], X[0], X[0]],
[Y[0], Y[0], Y[-1], Y[-1], Y[0]],
color="r",
linestyle="--",
)
ax1.set_aspect("equal")
f1.tight_layout();
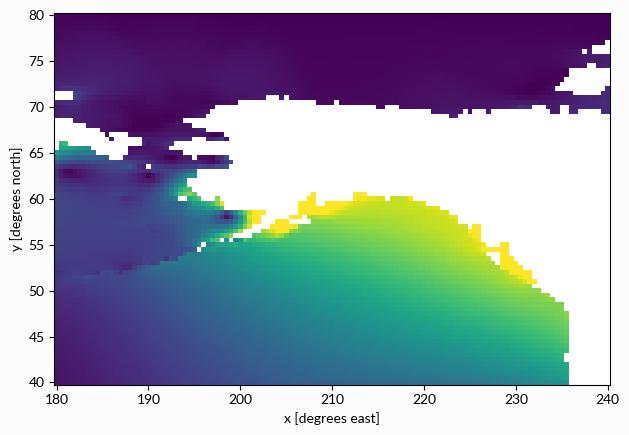
# crop the dataset to the grid of points
cropped = ds.tmd.crop(bounds=(X[0], X[-1], Y[0], Y[-1]))
# plot the amplitude of the same tidal constituent
f2, ax2 = plt.subplots(num=2)
cropped.m2.tmd.amplitude.plot(
    ax=ax2, vmin=vmin, vmax=vmax, cmap="viridis", add_colorbar=False
)
ax2.set_aspect("equal")
f2.tight_layout()
# interpolate the global dataset to the points
%timeit ds.tmd.interp(x, y, method="linear")
# interpolate the cropped dataset to the points
%timeit cropped.tmd.interp(x, y, method="linear")
65.8 ms ± 769 μs per loop (mean ± std. dev. of 7 runs, 10 loops each)
36.5 ms ± 310 μs per loop (mean ± std. dev. of 7 runs, 10 loops each)