Examples
Important
Running the example notebooks requires a full installation to include all of the optional dependencies.
Some notebooks require first downloading a tide model [see details on data access].

Compare NOAA Tides

Gap Fill Tide Map

Plot Antarctic Cotidal Charts

Plot Arctic Ocean Map

Plot ATLAS Compact

Plot Ocean Pole Tide Map

Plot Solid Earth Tides
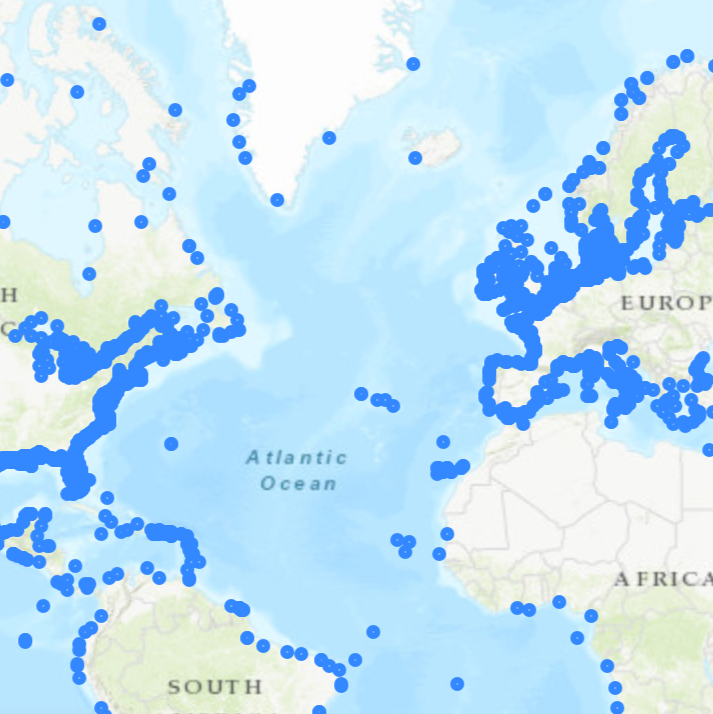
Plot TICON Stations

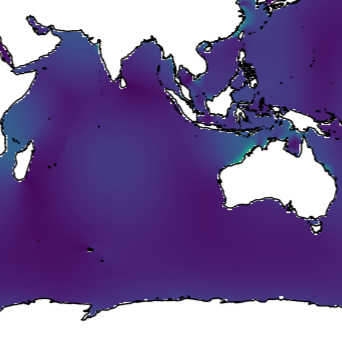
Plot Tide Forecasts

Plot Tide Form Factor
Plot Tide Range

Solve Synthetic Tides