Gap Fill Tide Map
This notebook demonstrates using the inpaint interpolation function to gap fill a tide model. This is useful for creating tide maps that can be easily interpolated using out-of-the-box utilities (such as xarray interpolation routines). However they require use of a land-sea mask to limit the interpolation to valid regions.
Important
Need to download tide model prior to running this notebook.
OTIS format tidal solutions provided by Oregon State University and ESR
Global Tide Model (GOT) solutions provided by Richard Ray at GSFC
Finite Element Solution (FES) provided by AVISO
Python Dependencies
Program Dependencies
interpolate.py: interpolation routines for spatial dataio.model.py: retrieves tide model parameters for named tide modelsio.OTIS.py: extract tidal harmonic constants from OTIS tide modelsio.ATLAS.py: extract tidal harmonic constants from netcdf modelsio.GOT.py: extract tidal harmonic constants from GSFC GOT modelsio.FES.py: extract tidal harmonic constants from FES tide models
Note
This notebook uses Jupyter widgets to set parameters for calculating the tidal maps.
Load modules
import pyTMD.io
import pyTMD.tools
import numpy as np
import cartopy.crs as ccrs
import matplotlib.pyplot as plt
import matplotlib.colors as mcolors
Set parameters for program
Model directory
Tide model
Constituent to read
# available model list
model_list = sorted(pyTMD.io.model.ocean_elevation())
# display widgets for setting directory and model
TMDwidgets = pyTMD.tools.widgets()
TMDwidgets.model.options = model_list
TMDwidgets.model.value = "GOT4.10_nc"
TMDwidgets.constituents.value = "m2"
TMDwidgets.VBox(
    [TMDwidgets.directory, TMDwidgets.model, TMDwidgets.constituents]
)
Read a constituent from a tide model
# get model parameters
model = pyTMD.io.model(
    TMDwidgets.directory.value,
).from_database(TMDwidgets.model.value)
c = TMDwidgets.constituents.value
# open dataset
ds = model.open_dataset(group="z", chunks="auto")
# subset to selected constituent
original = ds.tmd.subset(c)
# use inpaint to fill gaps in the model
gap_filled = original.tmd.inpaint(N=100)
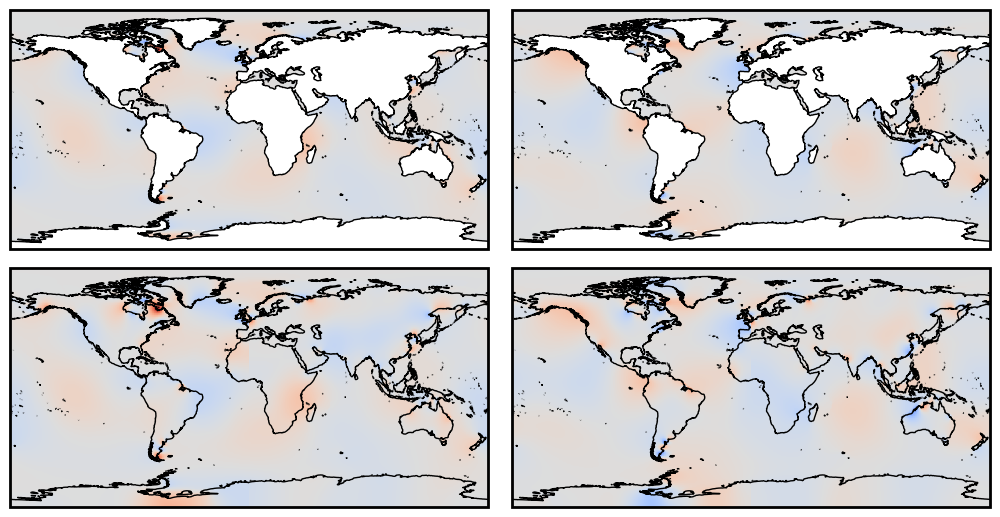
Plot original and interpolated constituent
fig, ax = plt.subplots(
    nrows=2,
    ncols=2,
    sharex=True,
    sharey=True,
    figsize=(10, 6),
    subplot_kw=dict(projection=ccrs.PlateCarree()),
)
# plot images
norm = mcolors.CenteredNorm(vcenter=0.0)
original[c].real.plot(
    ax=ax[0, 0],
    norm=norm,
    cmap="coolwarm",
    add_colorbar=False,
    add_labels=False,
)
original[c].imag.plot(
    ax=ax[0, 1],
    norm=norm,
    cmap="coolwarm",
    add_colorbar=False,
    add_labels=False,
)
gap_filled[c].real.plot(
    ax=ax[1, 0],
    norm=norm,
    cmap="coolwarm",
    add_colorbar=False,
    add_labels=False,
)
gap_filled[c].imag.plot(
    ax=ax[1, 1],
    norm=norm,
    cmap="coolwarm",
    add_colorbar=False,
    add_labels=False,
)
# adjust plot details
for ax1 in ax.flatten():
    # add moderate resolution cartopy coastlines
    ax1.coastlines("50m")
    # set global view
    ax1.set_global()
    # no ticks on the x and y axes
    ax1.get_xaxis().set_ticks([])
    ax1.get_yaxis().set_ticks([])
    # stronger linewidth on frame
    [i.set_linewidth(2.0) for i in ax1.spines.values()]
# adjust subplots and show
fig.subplots_adjust(
    left=0.01, right=0.99, bottom=0.10, top=0.95, hspace=0.025, wspace=0.05
)
plt.show()